


Описание SpecStream Audio Spectrum Plot
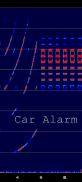
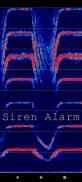
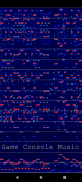
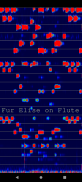
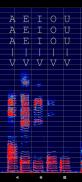
App gets audio data from microphone and plots the real time spectrum in the form of a scrolling image.
App settings:
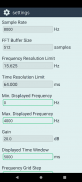
- Sample Rate = the Sample Rate (in Hz) at which the microphone will be read. Fixed to 8000 Hz in this free version.
- FFT Buffer Size = the size (in samples) of the audio buffer used to compute the FFT. Fixed to 512 in this free version.
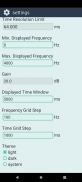
- Min. Displayed Frequency
- Max. Displayed Frequency
- Gain, fixed to 20dB in this free version.
- Displayed Time Window (in milliseconds)
- Frequency Grid Step (in Hz) = will draw horizontal division lines
- Time Grid Step (in milliseconds) = will draw vertical division lines moving together with the plot.
- Theme = app UI theme (light / dark). Affects only the UI. Does not affect the plot colors.
Enjoy :)
SpecStream Audio Spectrum Plot - Версия 1.2.0
(26-02-2024)SpecStream Audio Spectrum Plot - Информация об APK
Версия APK: 1.2.0Пакет: com.hardcodedjoy.specstreamПриложения в этой категории
Вам также могут понравиться...


